K-12 Textbooks and Supplements
HISTORY OF K-12 TEXTBOOKS
In the 17th century, the schoolbooks were brought over from England. By 1690, Boston publishers were reprinting the English Protestant Tutor under the title of The New England Primer. The Primer was built on rote memorization. By simplifying Calvinist theology the Primer enabled the Puritan child to define the limits of the self by relating his life to the authority of God and his parents. The Primer included additional material that made it widely popular in colonial schools until it was supplanted by Webster’s work. Noah Webster’s The Blue Backed Speller of was by far the most common textbook from the 1790s until 1836, when the McGuffery Readers appeared. Both series emphasized civic duty and morality, and sold tens of millions of copies nationwide.
Webster’s Speller was the pedagogical blueprint for American textbooks. It was so arranged that it could be easily taught to students, and it progressed by age. Webster believed students learned most readily when he broke a complex problem into its component parts and had each pupil master one part before moving to the next. Webster said that children pass through distinctive learning phases in which they master increasingly complex or abstract tasks. He stressed that teachers 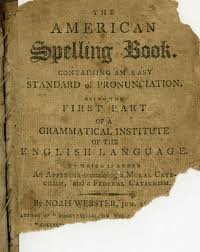 should not try to teach a three-year-old how to read—wait until they are ready at age five. He planned the Speller accordingly, starting with the alphabet then covering the different sounds of vowels and consonants, then syllables. Simple words came next followed by more complex words then sentences.
Webster’s Speller was entirely secular. It ended with two pages of important dates in American history, beginning with Columbus’s in 1492 and ending with the battle of Yorktown in 1781. There was no mention of God, the Bible, or sacred events. Webster’s speller was the secular successor to The New England Primer with its explicitly biblical injunctions.
Compulsory education and the subsequent growth of schooling in Europe led to the printing of many standardized texts for children. Textbooks have become the primary teaching instrument for most children since the 19th century.
Technological advances change the way people interact with textbooks. Online and digital materials are making it increasingly easy for students to access materials other than the traditional print textbook. Students now have access to electronic and PDF books, online tutoring systems and video lectures. An example of e-book publishing is “Principles of Biology” from Nature Publishing.
An increasing number of textbook authors are foregoing commercial publishers and offering their textbooks under a creative commons or other open  license. The New York Times recently endorsed the use of free, open, digital textbooks in the editorial “That book costs how much?”
In November 2012, Louisiana became the first state to reject an entire slate of textbooks because they were not aligned with the Common Core. They included every math and reading textbook in the state’s most recent adoption cycle, among them bids from Houghton Mifflin Harcourt, McGraw Hill and Pearson. The state has mostly left districts to their own devices when it comes to curriculum, though, and schools are relying on a mix of teachers, consultants and curricula from other states for new lesson plans.
THE K-12 TEXTBOOK MARKET
(The following is an abstract from “Games for a Digital Age”)
SELLING CURRICULUM TO SCHOOLS
Overview
Selling anything to schools is a difficult and time consuming process. However, K-12 is a large market and steady growth in student enrollments is expected. The market is divided into public and private and further segments into grade and curriculum area. Because purchase authority is determined by rank – superintendent, principal, curriculum coordinator, and teacher, buying decisions are mostly a function of product pricing.
K-12 schools are a $600 billion market. However, they are also a complex market that may seem difficult to access because few rules that apply on the consumer side apply to the K-12 institutional space.
Districts
 The single most important factor affecting K-12 marketing and sales is the size of the district (see: K-12 Education). Examining the educational technology market from a geographical or district funding viewpoint can overlook the vast majority of districts nationwide.
The sales process is very different depending on the size of the district. Larger districts often require several years of “pilot testing” before anything can be rolled out district-wide, and employ a formal purchasing process that may involve several levels of approval and multiple committee presentations. Smaller districts may still have a formal purchasing process, but the decision-process may be much simpler.
When 6% of the districts contain over 50% of the student population, they also have over 50% of the money. The larger publishers have dedicated personnel selling to the largest school districts. Smaller companies and startups do not have the capacity or time to sell to the largest 2% of districts (those with 25,000 students or more), in spite of the fact that these districts have 33% of the students. At the other extreme, there are 6,400 districts with fewer than 1,000 students—a lack of volume that makes it hard to justify any targeted sales to this segment. The sweet spot is the 3,500 districts with between 2,500 and 25,000 students. They have approximately 50% of the students in the country.
 District size also has an impact on technology infrastructure. Smaller districts, particularly those with under 2,500 students, are unlikely to have sophisticated IT infrastructure and may be outsourcing critical functions. These districts are very likely to have need of IT infrastructure services, including cloud computing that can provide backup and security.
One additional market approach is to target education service agencies. These are consortia formed by smaller districts in order to consolidate their buying power. These “intermediate units” are influential and an important sales target. They are known by different names and acronyms in different states. For example, in New York these are BOCES; in Texas ESCs; and in Georgia and Michigan they are RESAs. Most of these belong to the Association of Education Service Agencies.
Funding
NCES projects that spending will grow from the current $10,439 per pupil to $11,905 in 2020. Overall, public school spending is projected to increase from $513.8B to $627B in 2020.
In most years, approximately 92% of school funding has come from state and local sources. These funds are largely spent on capital outlays and salaries. On average, 48% of funding for education comes from state sources and 44% comes from local funding; however, average household income in a community directly affects the amount of funding its local schools will have. As a result, per-pupil spending varies widely, with economically healthy states and more affluent communities more likely to devote resources to educational technologies. Because funding for education is dependent on tax revenues, education budgets are the last to suffer in a recession, and the last to recover.
The relative contributions of state funding (48%), local funding (44%), and federal funding (8%) have remained constant for some time. While federal dollars constitute only 8% of total funding, this money is very important to the technology vendor community because it supports supplemental programs and services that often include technology. Furthermore, in 2009 the American Recovery and Reinvestment Act (ARRA), “the Stimulus,” provided a onetime additional $97.4B to education department budgets for direct K-12 program support as well as postsecondary and adult education.
The ARRA funding also included $39.7B from the education portion of the “State Fiscal Stabilization Fund” designed to augment depleted state budgets. Federal funding for K-12 education comes principally from three distinct sources. The Department of Education administers two of these: the Elementary and Secondary Education Act (ESEA, currently designated “No Child Left Behind”) and its ten Titles, and parts and the Individuals with Disabilities Education Act (IDEA). The third source, the E-Rate, is administered by the Universal Service Administrative Company (USAC) under the direction of the FCC. Other agencies, such as the National Science Foundation, NIH, and NASA support research in education and have Small Business Innovation Research (SBIR) programs that are designed to support Research and Development that has the potential for commercialization.
Policy and Funding: Looking Forward
Although political rhetoric in favor of innovative new models for education has been fervent, the current funding situation for educational technology—at both the national and state level—is not promising for FY 2013 or 2014. Cuts in both overall public education budgets and in funds earmarked for technology speak to other priorities and to the economic stresses dominating U.S. government and state-level policy.
 While the U.S. Department of Education is projecting rising costs for K-12 educational institutions in the form of almost 260,000 new children to educate in the 2011–2012 school year, the Center on Budget and Policy Priorities reports that in the coming fiscal year, “at least 23 states have enacted identifiable, deep cuts in Pre-K and/or K-12 spending.” Even those products being purchased with more generally allocated funds may see a drop in institutional sales over the coming year. In those areas where sales of technology products and services come from non-technology funds, the picture is not encouraging.
Despite this overall downturn in funding, there is promise for educational technology. Technology will receive an increasingly larger proportion of the shrinking pool of funds if it can further demonstrate value in terms of both educational effectiveness and cost efficiency.
K-12 MARKET DYNAMICS
Overview
In this section we present the common market categories for institutional sales. As noted by Valerie Sakimura, Senior Analyst, New Schools Venture Fund, “One of the problems with going to scale is that the distribution channel is very tricky to figure out.” District distribution channels not only are distinguished by district size, as mentioned above, but also by grade level and curriculum area.
MARKET SEGMENTATION
State Adoption of Instructional Materials 
Twenty-two states follow a formal adoption process to review and approve K-12 textbooks and other core resources. The primary goal of the process is to ensure that core materials align with state standards and meet state regulations relating to a range of requirements. In most states, local school districts can use state funds only for approved and adopted resources, though some states require only a percentage of the funds be used for approved resources.
 Roughly $7 billion is spent each year on K-12 instructional resources, and adoption state purchases make up roughly 1/3 or $2.2 billion of the total. The adoption process is a high-stakes game with significant risks, costs, and rewards for vendors. Adoption is “all or nothing.” If a textbook is adopted, it can be sold as core curriculum in the adopting state. If a textbook fails to be adopted, a district cannot use state money to buy it, which virtually excludes it from consideration by other districts in the state. Typically multiple products are approved for adoption. In this way, adoption gives the publisher a “hunting license”, but it is still necessary to convince individual districts to purchase your product.
Winning adoption in the influential states of Florida, Texas, and California makes the adopted product much more valuable in all states and almost guarantees its success. The adoption process includes a strict schedule spanning more than six years. There is a lengthy review process to verify each state’s standards alignment, adherence to other state regulations, and district quality reviews. Political trends, such as the role of drill and practice in math education, can also play a role in adoptions.
The minimum cost of submitting a product for adoption is estimated at $1 million per subject area, per state. For basal reading or mathematics, the cost can be as much as $50 million nationwide. Print-based materials still make up about 90% of the basal programs adopted in the 22 adoption states; adoption of digital materials has been slow.
Content Areas
District budgets are allocated to specific curriculum content areas. Typically, different curriculum coordinators have responsibility over their own area of expertise. Historically reading/English language arts (ELA) and mathematics together had the lion’s share of the curriculum budget, and with the advent of high-stakes testing, even more emphasis has been placed on these two areas.
A 2011 educational technology survey by The Software & Information Industry Association (SIIA) on digital products and services preK-12 reported a stronger emphasis on reading, English  and language arts (47% of total) than has been reported in other market studies that combined digital and print products (SIIA 2011). The SIIA survey also found higher overall sales in Science (19%) and lower sales in social studies/history and other content areas (5% each).
Overall findings from the SIIA report, Resnick 2012, and the American Association of Publishers 2010 surveys, show dominance by English/language arts materials’ revenue from sales of content, with arithmetic/mathematics in second place for all studies.
The particular capability of technology to provide simulations, probes, and interactivity may contribute to the outcome for science materials in the SIIA survey. It should be noted that all of the studies were undertaken before rather significant digital science adoption competitions in both Texas and Florida.
The report of the SIIA survey estimated that the overall market for digital instructional content approaches $3B in the U.S., with revenue from market segments for digital content areas as follows:
• English/language arts is close to $1.4B.
• Mathematics is near $696MM.
• Science is close to $553MM.
• Social studies is close to $160MM.
• Other content areas are close to $160MM.
Direct sales (where the company controls the sales channel), can be separated into four basic channels. The least expensive items are sold by mail order or through a company’s web site. More expensive products are sold (in order from lowest to highest price of product) through telesales, an inside sales force, or a field sales force. Expensive products can take up to eighteen months for a sale to close and require a direct relationship sell to a superintendent. At the other extreme, less costly items can be purchased by teachers using a restricted budget or their own money.
Sales price determines channel, customer, type of product and sales cycle. Indirect sales or “sales outsourcing,” uses an external company (a third party), to complete the sale. This keeps overhead low and allows a small company such as a game developer to concentrate on what they do best. Typically, the third party will take a percentage of the sale. Indirect sales are particularly effective if there is demand—because, for example, a product has received positive publicity. Third parties have no commitment to your products and will sell whatever the customer is requesting. Going to indirect sales does not reduce the need for a solid marketing effort—if anything, it actually requires more.
Correlation of Sales Price, Cycle, Type of Product, Customer and Direct Sales Channel
Sales Channel Customer Product Type Sold Sales Cycle Typical Sale
Field Sales Superintendent Enterprise Integrated 18 Months $50,000+
Inside Sales District/Site Adm. Single Solutions 6–12 Months $5,000/$25,000
Telesales Principal/ Teacher Packaged Products 90 Days $1,000/$2,500
Mail/Web Teacher Packaged Products 30 Days $100/$500
For inexpensive items, a company can use a distribution outlet, including catalog sales. Resellers and Value Added Resellers (VARs) are similar in scale to telesales, handling products with a typical sales price of $2,500–$5,000. Independent agents are parallel to a field sales force and may specialize in particular large districts where they know the terrain.
The School Buying Cycle
Generally, the buying cycle in education follows a predictable fiscal year seasonal calendar and a July 1 through June 30. In addition, structural constraints designed to protect public monies and reinforce competitive bidding affect the timing and length of the sales cycle.
In anticipation of new budgets beginning in July, major content conferences occur in the spring. These conferences are designed to produce leads for sales in the following fiscal year. For products that are ready to launch, the timing of these conferences is critical.
That said, purchasing decisions in the education market are highly decentralized, with patterns and dates that vary from state to state and even from district to district within a state. It is common in the education market to have funds encumbered long before they are spent. Vendors are compelled to continuously market and sell to schools in order to remain involved in the process. The buying cycle for major products typically involves four stages.
Typical school buying cycle for major products
- July–November – Determination of need and selection of products to review
- December–March – Request for Proposal (RFP) process
- March–May – Review of RFP responses and vendor selection
- June–August – Issuance of purchase order by district
MARKET LEADERS
In the educational market a few huge players dominate in all content categories. This certainly presents barriers to entry that for new players can appear insurmountable. As Laurie Racine, Co- Founder and Managing Director of STARTL, puts it, “Distribution in K-12 is a key problem because of the big three publishers.” These publishers have products and services in almost every K-12 market segment and have expanded through aggressive acquisitions, particularly in the last ten years. In the arena of learning games and interactives, they have successfully partnered or outsourced work to game developers such as Tabula Digita and 360KID.
In addition, second tier companies have also been fairly active in mergers and acquisitions. Private equity has also taken an interest in the education space, as seen in the acquisition of BlackBoard and Edline and the sale of Archipelago Learning.
 In addition to the education market players, giant companies such as Microsoft, Adobe, Oracle, IBM, NBC, Discovery, and NewsCorp, who normally are not in the education space, have taken a significant interest in education during the last decade. NewsCorp acquired Wireless Generation in 2010 for example, for approximately $360 million in cash.
The other large category of major players in education is the testing businesses such as: ETS, Scantron, College Board, and Princeton Review. Scantron purchased GlobalScholar in 2011, just after Global Scholar had acquired Spectrum K12.
More than half of those interviewed mentioned market dominance by large publishers as a major impediment to the success of learning games. The consensus was that this dominance hinders innovation. According to Constance Steinkuehler, Senior Policy Analyst at the Office of Science and Technology Policy in the Executive Office of the President of the United States and an assistant professor at from the University of Wisconsin-Madison, “Huge textbook publishers dominate the market and squash innovation and the smaller publishers sweep around the edges but with little innovation. The model of point-by-point purchase by the teacher, individual, or parent and how to sell to this market, needs to be resolved.” This is particularly important given what teachers spend on materials.
Further, the sheer size of the “big three” makes them slow to adapt to new trends in educational games. As Scott Traylor, CEO and founder of 360KID, has found: “The larger publishers often take two or three years to move forward and are having a lot of trouble transitioning from print and do not understand what makes a good game. The smaller more nimble players who make engaging learning games have trouble getting into the adoption cycle or at least seen by districts, administrators or teachers who might be interested in their game.”
2010 and 2011 revenue for the largest companies in the K-12 institutional market:
2011 2010
Company Total Revenue K-12 Revenue Total Revenue K-12 Revenue
Pearson $9,058 M $3,993 M $8,759 M $3,500 M
McGraw-Hill $6,246 M $949 M $6,072 M $1,109 M
HMH $1,1295 M $1,295 M $1,507 M $ 1,507 M
Given this, one way for newer or smaller companies to enter the market is to partner together or with one of the Big Three (Pearson, McGraw Hill, Houghton Mifflin Harcourt) —a significant  opportunity for current investors to pursue. For example, Muzzy Lane sees partnering with a large publisher as a good strategy going forward because the Big Three have long ago figured out distribution and sales issues, and because the big entities are finally ready to enter the learning games market to some degree. Co-founder and president Dave McCool reports with enthusiasm that this partnership is working well. “[Muzzy Lane] started very much on a supplemental line with McGraw Hill, but now they are looking for more interactive stuff, not just digitized textbooks.
Klopfer and Haas explain the benefits of partnerships: “Most of these companies, individuals, and nonprofits know little about schools, teachers, students, or the market forces operating on each of them. At best they know only one piece of this puzzle. It is hard to know more than that. But given the volume of interest and the growing expertise in educational media production, particularly in games, more efforts can succeed if the right partners come together.”
The systemic barriers to entry include:
• The dominance of a few multi-billion dollar players;
• A long buying cycle, byzantine decision-making process, and narrow sales window;
• Locally controlled decision making that creates a fragmented marketplace of individual districts, schools, and teachers;
• Frequently changing federal and state government policies and cyclical district resource constraints that impact the availability of funding;
• The demand for curriculum and standards alignment and research-based proof of effectiveness; and
• The requirement for locally delivered professional development.
KEY MARKET DEMANDS
Standards Alignment
Throughout the 1990s, legislative activity relating to education focused on raising academic standards and holding schools accountable for student performance. By the late 1990s, the vast majority of states had developed standards for English/language arts, math, science, and social studies. These standards directly impacted curriculum, as well as “high-stakes” statewide assessments. By the year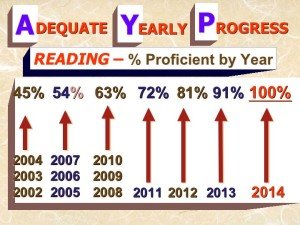 2000, almost all states were administering tests in 4th and 8th grades, and states were issuing district report cards annually.
The federal No Child Left Behind (NCLB) Act of 2001 increased attention given to standardized testing by mandating assessment and accountability for all states. A measure of Annual Yearly Progress (AYP) became a critical school-level evaluation with punishments instituted if schools failed to achieve AYP goals. Since the passage of NCLB, each state has created its own process for developing and implementing standards. Standards for what students are expected to know vary greatly from state to state.
Schools have focused their efforts on making sure students are able to pass state standardized tests, and this has created both a challenge and a market for any basal or supplementary curriculum resource that is effective in helping teachers assist their students in meeting the goals of NCLB legislation. According to Steinkuehler, “Schools don’t have money unless they can tie the instructional materials to standards. And teachers cannot justify a purchase unless it will contribute to learning standards.”
Such standards present both challenges and opportunities for learning games. Short-form drill and practice games that include formative assessment and teacher feedback are becoming more  attractive to teachers seeking ways to help students achieve required proficiencies. Short-form skills practice games such as MotionMath, Sokikom, and Dreambox, as well as other curricular materials that are aligned to state standards, are seeing increased adoption in schools as well.
Core vs. Supplemental Material
It is rare for a teacher to make an individual decision on the core curriculum, but teachers do frequently choose supplemental materials on their own. In the 1980s, basal curriculum accounted for as much as 75% of spending on instructional materials. By 2000, spending on basal and supplemental had  become equal. Now supplemental instructional materials, including testing and assessment and reference materials, are at least double the basal.
In addition, the line between what is considered basal and what is considered supplemental is being blurred. Some schools are finding that their needs are better met through picking and choosing supplemental materials than through a monolithic basal product.
Because purchase of supplemental materials can sometimes be funded through nontraditional instructional materials budgets, supplemental content needs to be linked to standards. In the future, vendors may need to meet other curriculum requirements such as scope and sequence, as well as appropriate reading level. Today, publishers are required to submit a worksheet correlating their content to standards. This is challenging to complete for digital materials, particularly games, given the non-linear, adaptive interfaces involved with online content.
THE “BROKEN MARKET“
The textbook market does not operate in exactly the same manner as most consumer markets. First, the end consumers (students) do not select the product, and the product is not purchased by faculty or professors. Therefore, price is removed from the purchasing decision, giving the producer (publishers) disproportionate market power to set prices high. Similarities are found in the pharmaceutical industry, which sells its wares to doctors, rather than the ultimate end-user (i.e. patient).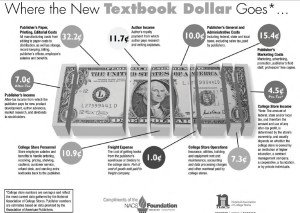
This fundamental difference in the market is often cited as the primary reason that prices are out of control. The term “Broken Market” first appeared in Economist James Koch’s analysis of the market commissioned by the Advisory Committee on Student Financial Assistance.
This situation is exacerbated by the lack of competition in the textbook market. Consolidation in the past few decades has reduced the number of major textbook companies from around 30 to just a handful. Consequently, there is less competition than there used to be, and the high cost of starting up keeps new companies from entering. Wikipedia
COMMON CORE AND CURRENT TEXTBOOK DYNAMICS
The following is an abstract of the article “WHAT’S HAPPENING AT THE CORE?” By Sarah Bayliss, School Library Journal, 2/2014
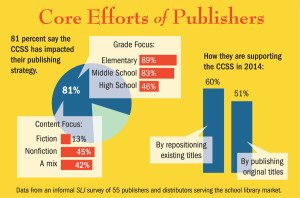 Publishers and distributors are providing an immense amount of CCSS-aligned materials and professional development (PD) support, ranging from teacher manuals and conferences to webinars to interactive learning tools. According to an informal December 2013 SLJ survey of 55 publishers and distributors who serve the school library market, 81 percent provide texts aligned to the CCSS, particularly for grades K–5 and 68 percent offer PD materials. Of these 66 percent will reposition existing titles to show CCSS alignment this year, and 51 percent will develop original titles for the same purpose.
Educational publishers are seeing their highest profits in eight years. Revenues rose by seven percent through September 2013, compared to a 14 percent decline in 2012, says Jay Diskey, executive director of the PreK–12 Learning Group Division of the Association of American Publishers. Such an increase has not occurred since 2005, Diskey says, though “the Common Core is not the only reason for that. This is a bounce-back from the recession. The educational publishing industry was hit very hard. School districts were broke.” He adds, “We have seen a pent-up need for new materials.”
Quest for Resources
Teachers want support and publishers are providing lots of it. Some maintain that educators are struggling due to the lingering impact of the recession, publishers’ revenues notwithstanding. “Reform needs a lot of money behind it,” says Nell Duke of the University of Michigan. “The Common Core has come at a moment when school budgets are really strained. It’s bad timing as budgets are shrinking, and adopting the Common Core doesn’t necessarily come with money. The biggest [need is for] professional development.”
 Forty-nine percent of publishers’ and distributors’ who deal in CCSS-aligned titles offer CCSS collections and series, educational technology, databases, and other materials, according to a SLJ survey. Eighty-nine percent produce CCSS materials for K–5; 83 percent also focus on the middle grades; while 46 percent work the high-school market. Regarding content, 45 percent focus on nonfiction, a major shift in the new standards; 13 percent on fiction; and 42 percent a mix of both.
Within PD materials, 83 percent provide teacher guides, 63 percent reader guides, 40 percent offer digital discussion guides, and 30 percent have created PD resource lists, along with webinars, conferences, one-on-one support, regional and statewide coaching, and other resources.
Publishers and the Common Core
Both large and small publishers offer sites that are searchable by the standards and support material, including the major trade publishers—Hachette, Penguin Random, HarperCollins, Macmillan, and Simon & Schuster—along with educational, series, and smaller niche publishers.
Common Core-positioned titles are a natural for primarily nonfiction publishers including Rosen, Lerner, Clarion, National Geographic, Rourke, and others. Lerner provides CCSS research and writing tools through its Common Core Connections site and Common Core Libraries series, along with detailed information on text complexity. ABDO’s imprint, Core Library, features more than 300 CCSS-related titles. “We welcome the Common Core,” says Roger Rosen, president of Rosen Publishing. “We think it’s an elegant document and well-conceived, encouraged by the assumption of rigor for all students. A refusal to dumb down materials and have kids read and be engaged in a way we feel very congruent with.”
 That vision is embedded within the company’s publishing program—on the print side and on the digital. Products like Rosen Classroom’s InfoMax Common Core Readers, Rosen Interactive eBooks, and Digital Literacy database support comparative text analysis and other standards.
The CCSS provides “a good opportunity to re-promote books that are being used in the classroom,” says Lucy Del Priore, Macmillan Children’s Publishing Group school and library marketing director. Del Priore says that titles by Macmillan authors from Jack Gantos to Peter Sís are being positioned for CCSS teaching. Other trade publishers are following suit. Dorling Kindersley, a division of Penguin Random, features deep Common Core offerings at us.dk.com/commoncore, while Penguin Young Readers also offers CCSS materials. Simon & Schuster’s Common Core site features CCSS teachable titles—such as Brian Floca’s Locomotive—with discussion questions, and many other resources.
While Macmillan’s digital catalog is “a terrifically filtered database,” Del Priore says, she believes that educators will go to the distributors, including Baker & 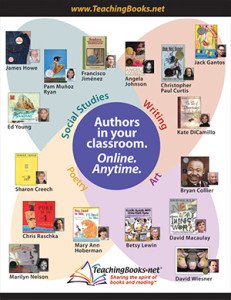 Taylor, Ingram, Follett, and Mackin, in order to find their teaching resources.
To help educators navigate materials, “Common Core information is being filtered down by professors and people writing articles,” Del Priore adds. “Do you want to go to 10 websites for resources, or one spot?” She notes, “We share [our materials] with third-party sites like TeachingBooks.net. Teachers are more likely to go to a source like that.”
“We’re curating the materials that publishers are providing,” says Baker & Taylor director of merchandising Diane Magnan. “The strategy is around credibility and cutting through the noise out there.” This month, the distributor is launching a revamped site devoted to the CCSS with “publishers’ resource teaching guides, reading group guides, and lists based on appendixes,” among other resources. Educators tell Magnan, “Don’t just put a sticker on a book.” They’re looking for deeper guidance.
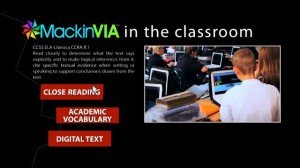 Mackin Educational Resources seeks to provide that through the distributor’s Classroom Services, featuring a CCSS focus, along with its Core Knowledge title lists and other resources, including those for PD. Follett’s support encompasses CCSS text exemplars, curriculum maps, and more.
For Solution Tree, a company dedicated to professional development, materials oriented to the CCSS now constitute about 10 percent of revenue, says Solution Tree Press president Douglas Rife. “Seven of our top 10 titles in 2013 were on the Common Core,” he says, with webinars, Web conferencing, coaching, interactive video, and support for English-Language Learners (ELL) in the mix. “We do a lot of custom work” on the state, district, and local level, Rife says. “The next big wave is going to be assessment” support materials.
In addition to the teaching titles, Capstone’s division Capstone Professional Services features “webinars supporting Capstone professional titles written by educators who are experts in their field and the Common Core,” according to Cox. Along with features such as CCSS resources in Capstone Classroom, “We have 100 Capstone reps across the country visiting libraries every day.”
 Enslow Publishers takes a different approach to CCSS guidance. “We tried to solve the problem of Common Core correlations and anchor standards looking like a bunch of numbers and letters,” says president Mark Enslow. “We use a visual way of showing how our books fit the Common Core.” The sophisticated website uses “green checks where we show the anchor standards—scaled to national standards.”
Enslow adds, “I found that school librarians were pretty much on top of” the standards during conversations at the American Association of School Librarians conference. “But when our public library customers came by, they were quite confused. There’s work to be done there. They wear so many hats and serve so many clients.”
“Teachers tell me they want short, high-interest texts they can read in one class period,” says Rebecca Hinson of Rebecca Hinson Publishing, focusing largely on visual and art books.
Hinson’s offerings are often geared toward ELL students, who comprise 10 percent of the US public school population, and Hispanic students, who comprise 25 percent, according to Hinson.
 Florida-based Hinson sees that teachers “just want their kids to pass” the assessments. Ninety-one percent of ELL students failed the reading portion of the Florida Comprehensive Assessment Test, she says.
Last year was “the largest year ever within the educational unit of Scholastic,” says Margery Mayer, president of Scholastic Education, which offers text pairing, lesson plans, and PD in person in a variety of settings, and a range of other resources. Scholastic reps in the field will conduct “a workshop, classroom coaching, or give a presentation with a leading educator.” She adds that Scholastic supports “the half to two-thirds of students who are not reading proficient.”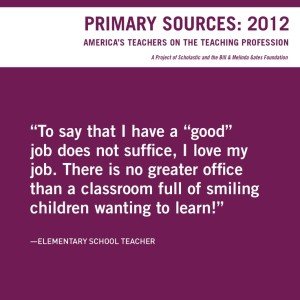
Scholastic partnered with the Bill and Melinda Gates Foundation to launch Primary Sources, with views from 20,000 teachers about the CCSS. “We found that teachers are supportive intellectually, conceptually. Where we have anxiety is around what it really looks like, what it means when the tests come down,” Mayer says. (see: K-12 Teaching/articles)
Hope and Anxiety: What do Teachers think about The Common Core Standards?
Some wonder if publishers’ eagerness to align material to the CCSS could be compromising standards. “There are publishers in a rush to say everything is Common Core, which in some cases means putting a Common Core label on a product that was created before the standards existed,” says Duke, noting that a book she wrote pre-CCSS was recently labeled as CCSS-relevant. However, she acknowledges that materials don’t have to be new to be teachable.
Regarding publishing oversight, Diskey says, “There has been talk over the past three or four years about having a national advisory group that would review or vet publishers’ materials. Nothing has gotten off the ground.” The reason is that at a time when there is significant backlash, it might be politically difficult to get something like that up and running.”


Recent Comments